How does an AI coding agent know if the code it wrote actually works in the browser?
Traditionally, it couldn’t. An agent would write a component, compile it, run a terminal command, and declare success. It had no way of knowing if the button was misaligned, if a console error crashed the page on load, or if a network request returned a 500 status. The agent was “blind” to the client-side runtime environment.
At Google I/O 2026, Google announced the stable 1.0 release of the Chrome DevTools for Agents MCP server (published as chrome-devtools-mcp).
By bridging the Model Context Protocol (MCP) to Chrome’s underlying debugging protocol, this tool gives coding agents the “eyes” and “hands” they need to audit, performance-tune, and bug-fix frontend applications autonomously.
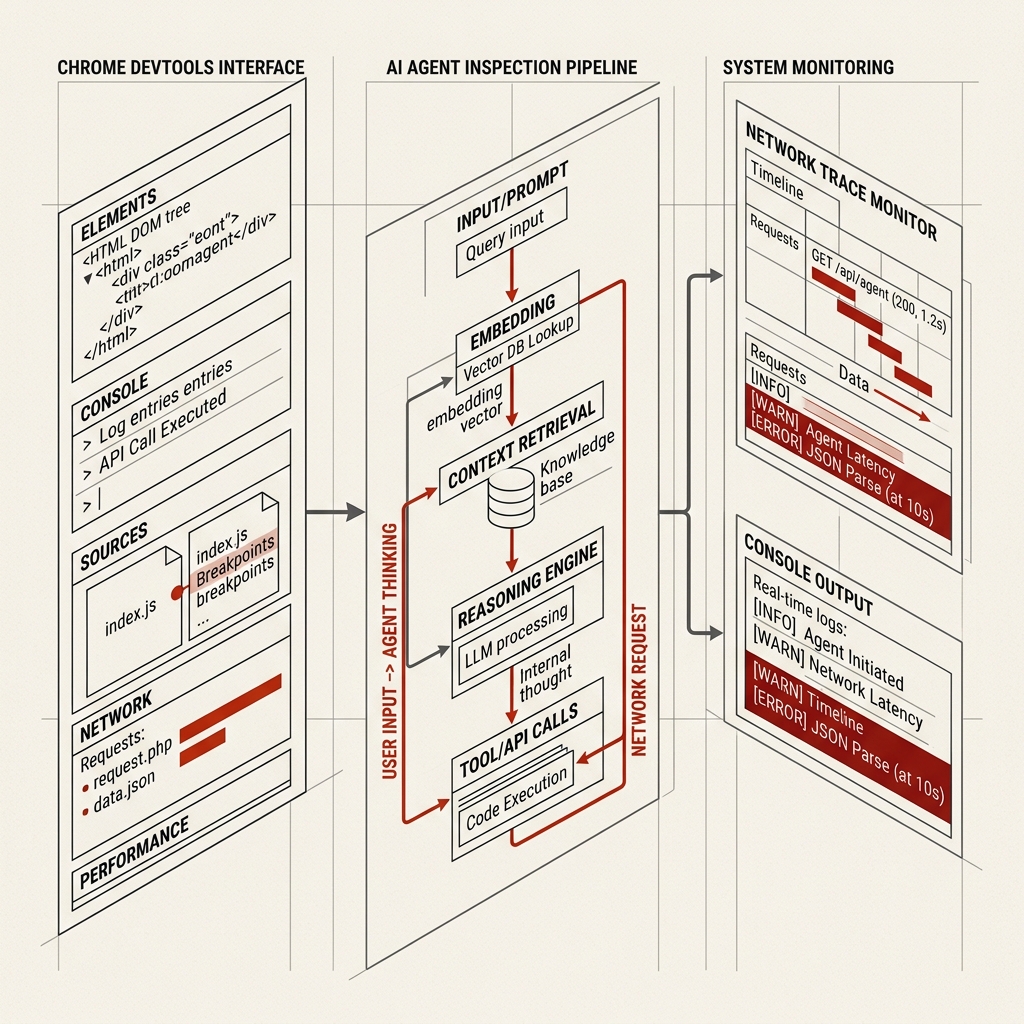
Here is a look inside how DevTools-driven agentic loops operate.
Giving AI Agents the DevTools Protocol
The Chrome DevTools Protocol (CDP) has long been used by developers for browser automation tools like Puppeteer and Playwright. However, CDP is highly complex, emitting thousands of low-level JSON events. Feeding raw CDP logs to a Large Language Model would instantly overflow its context window and cause hallucinations.
The chrome-devtools-mcp server acts as an intelligent translator:
Agentic Debugging Flow:
+-----------------------------------------------------------+
| AI Agent -> MCP Call -> DevTools MCP Server -> Chrome CDP |
| AI Agent <- Clean Markdown <- DevTools MCP Server <- CDP  |
+-----------------------------------------------------------+
It exposes high-level, human-readable tools to the AI agent—such as inspect_dom_element, run_lighthouse_audit, and monitor_console_errors. The server runs the complex CDP routines in the background and returns a clean, structured Markdown representation of the page state to the agent.
Core Capabilities of DevTools MCP
With chrome-devtools-mcp installed, an AI agent (such as Antigravity, Cursor Composer, or Gemini CLI) gains access to four major debugging panels:
1. The Console Panel (Runtime Bug Hunting)
Instead of waiting for a user to report a blank screen, the agent can monitor the Javascript console programmatically.
If the agent navigates to a page and detects a runtime error:
- It intercepts the stack trace.
- It automatically searches the codebase for the file and line number that threw the error.
- It applies a fix, re-compiles, and refreshes the browser page to ensure the console error is gone.
// How an agent triggers Console Monitoring
// The DevTools MCP exposes a tool: listen_to_console_events()
const errors = await devtools.getConsoleErrors();
if (errors.length > 0) {
  const stack = errors[0].stackTrace;
  // Agent proceeds to fix the file identified in the stack
}
2. The Elements Panel (CSS & Layout Adjustments)
AI models are notoriously bad at CSS layout because they write styles blindly. With the DevTools MCP, the agent can inspect computed CSS styles:
- It can query an element’s bounding box to see if components overlap.
- It can capture a viewport screenshot to visually inspect alignment.
- It can execute live CSS overrides (e.g. changing
flextogrid) and verify the visual layout change immediately.
3. The Network Panel (API Debugging)
If a dynamic feature fails to load, the agent can inspect active network traffic. It can trace fetch requests, check header payloads, verify cookies, and inspect API response bodies.
If a request fails with a 401 Unauthorized or 500 Server Error, the agent can immediately trace the API route code and fix the backend database controller.
4. The Performance Panel (Core Web Vitals Tuning)
At the press of a button, an agent can run a Lighthouse audit on your site. The DevTools MCP returns the exact metrics for Largest Contentful Paint (LCP), Cumulative Layout Shift (CLS), and Interaction to Next Paint (INP).
If the LCP is too high because of an unoptimized hero image, the agent will:
- Locate the image tag.
- Rewrite it to use Next.js
<Image />or Astro’s dynamic picture components. - Add
fetchpriority="high". - Run the Lighthouse audit again to verify the speed improvements.
Setting Up Chrome DevTools MCP
For developers running agentic coding environments, setting up the DevTools MCP server is straightforward. It can be initialized as a standard MCP tool block:
// Add to your global MCP configuration (e.g., cursor-settings.json or claude-code.json)
{
  "mcpServers": {
    "chrome-devtools": {
      "command": "npx",
      "args": ["-y", "@google/chrome-devtools-mcp", "--headless=true"]
    }
  }
}
When headless mode is set to true, Chrome runs silently in the background of your compiler environment. If you set --headless=false, a physical browser window will pop up on your desktop, and you can watch the agent click buttons, type values, and inspect elements in real time.
The Autonomous Verification Shift
We are moving away from the era of static code generation. The future of software engineering lies in continuous autonomous verification.
By giving AI agents the same inspection tools that human developers use, we eliminate the gap between writing code and testing it. If an agent can run the code, open it in Chrome, inspect the console, and verify performance metrics before presenting the code to you, the rate of bugs drops to nearly zero.
Stable 1.0 is just the beginning. The agentic web is now fully interactive.